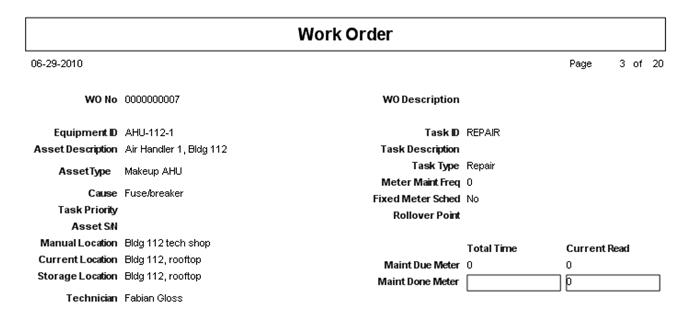
All of the reports in FaciliWorks are editable. Labels and fields can be added, moved, resized or deleted. For example, the Work Order report does not include the Asset Type field, but the report can be configured to add this field.
Before you start this process, it is recommended that you export the report that you will be changing to a file that can be accessed if needed. This will save a copy of the original report for later use if you need it. See Importing and Exporting Reports in the Administrator Guide for details.
Install CRD2.exe onto your Windows PC that also accesses FaciliWorks 8i. After installation, launch CRD2 and you are prompted for the FaciliWorks 8i URL, User ID and Password.
Click the Test button to ensure the information you entered is correct and then on the FaciliWorks Login window, click OK.
The Custom Reports window appears, listing all Enhanced and Standard reports contained in you 8i system.
In the Custom Reports list, click the report you would like to enhance or use as a template to start creating a new custom report and then click the Edit button. The Report Editor window is displayed.
The section on the left is the Designer Canvas, used to design your report. Every item on the Designer Canvas is a Report Control. The types of controls are shown on the toolbar at the top of the Report Editor. We will place a few of these controls on the canvas.
Controls can be added to any section of the report, including the field controls. To include a field in the report, select the field from the Fields frame and drag it to the canvas as shown below. Recall that when a field is added to the report, FaciliWorks adds two controls: a label control and a field control. The two controls may have identical names.
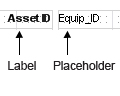
The Label Control is simply a label on the report. It can hold the title, column headers and report or page messages. In the case of a label control for a field, the label control holds the label or identifier of the field. The label text in a label control can be modified.
A Field Control is a placeholder for data populated from your database. The text in this control cannot be modified; in this example, FaciliWorks searches your database for columns named Equip_ID. If you change this name, the program will not find the data needed for the report and will either display a message that the data could not be found or present a report without data.
The placement of the controls will have a large impact on the outcome of your report design.
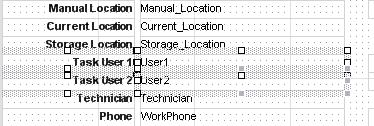
To add the Asset Type field to the report, first make room on the report canvas to position the field. In the example above, the Task User 1 and Task User 2 fields will not be needed on this report. They can be removed.
To remove the unwanted fields, first select them. Both the labels and the placeholders need to be removed for both fields. To select all fields to be removed, click the Task User 1 field. Then, while holding down the Shift key on your keyboard, click the remaining labels and placeholders to be removed. When finished, release the Shift key. If the fields are not adjacent, use the Ctrl key instead of the Shift key.
When you have selected all items to be removed, click the Delete key on your keyboard.
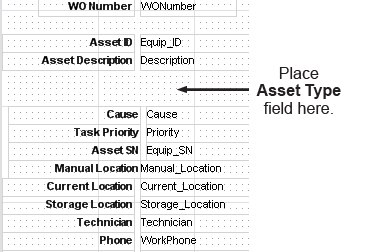
Now that you have created some space on your report, you can move the other fields to better position the Asset Type field. Suppose you want the Asset Type field to display under the Asset Description field. First, select both the label and placeholders for the Cause, Task Priority, Asset SN, Manual Location, Current Location and Storage Location fields (use the Shift key on your keyboard to select multiple fields). Release the Shift key.
When you have selected all fields to be moved, roll the mouse pointer over the fields you have selected. The cursor will change to a crosshair:

Click the left mouse button and while holding the button down, drag the fields downward to leave space for the asset type field. When the fields are placed where you want them, release the mouse button. You now have space for the Asset Type field.
When the Work Order report was created, a query was used to select information from the database. The fields available in this query are listed in the Fields pane located to the right of the report canvas. Use the scroll bar to locate the Asset Type field. The name of this field in the database is FS Type. Click the FS Type field to select it. Release the mouse button.
Click the FS Type field again with the left mouse button, and while holding down the button, drag the field onto the canvas and position it under the Description placeholder. Release the mouse button.
The label and placeholder for the FS Type field are placed on the report. The label is underlined. You will need to rename this label to match the other labels on the report. Click the FS Type label to select it.
To the right of the report canvas under the fields list is the Property Toolbox. Change the label name by first locating the Text property under the Data section of the toolbox.
Highlight FSType. Enter Asset Type by overwriting the current text.
The label on your report has changed.
Now modify the font of your label to match the other labels on your report. First, click the label of the Asset Description (you will copy the font properties of this label).
In the Property Toolbox, locate the Font property and click to highlight. Next, click the […] button to the right of this property.
The Font property window opens, displaying the font, font style and size. Close the window.
Next, select the Asset Type label on your report. Click the Font property in the Property Toolbox and then click the button to open the font property window. Change the properties to match the other labels. Remember to uncheck the Underline checkbox. When finished, click OK and close the window.
Change the alignment of the label to match the other labels. Click the Alignment property and then click the alignment drop-down. Select Right.
If you need to move the label to match alignment with the other labels, click the label and drag it to the left or right.
Repeat the steps to change the font of the placeholder to match other placeholders on your report. You are now ready to test the report modifications.
At the top of the report editor in the icon toolbars, click the Preview button.
The report displays with data from the database. Asset Type is now visible on the report.
If you need to make any other modifications, click the Design button on the report editor toolbar to switch back to design view.
After modifying the report, be sure to save it. To save the report, first make sure you are in Design View. Click the Save Report icon on the tool bar or use the File menu drop-down and select Save.
To delete a report from your database (from within the CRD2 application), click a report name to highlight it and click Delete. A dialog window will appear to confirm the deletion. Click OK to delete the report or click Cancel to keep the report.
To create a new report, click the Add button in the Custom
Reports window and the Report Editor window will open. Click
the New Report icon ![]() in
the toolbar and the Select Report Template window will open:
in
the toolbar and the Select Report Template window will open:
The FaciliWorks report editor includes templates to help you build reports. If you have a label printer, using the most common label formats will fast-track your label design. You may also use the Label Wizard to develop new label designs quickly. We will base this discussion on a basic blank report and build as we move along.
To better understand the report editor canvas, we’ll start with a blank report and discuss various elements of the report editor. Click Blank Report and click OK.
The editor is divided into four frames:
Fields: When connected to a database, all available fields will appear in this frame. You can then select any field and drag it to the canvas.
Report Contents: This frame displays a tree diagram of the sections of your report design. Click any item to display its properties in the Property Toolbox.
Property Toolbox: This frame lists the properties of
the object currently selected in the Report Contents and Fields
frames. The properties displayed vary depending on the object selected.
Designer Canvas: The canvas is divided into the sections listed in the Report Contents frame: Page Header, Detail and Page Footer.
Before creating a report, you must first connect to a data source. The fields for your report will come from this data source. On the toolbar, click the Set SQL Source button:
![]()
The Report Main SQL Entry window is displayed, with New SQL Source selected. This is the only way you can make a connection to a data source; click OK to proceed.
The SQL Builder dialog box opens, giving you three types of queries from which to choose. Simple Query and Advanced Query use a query wizard to guide you easily through the process. To use Direct-SQL Query, you must know the syntax used to create SQL commands. The options are described in detail below. Click on one of the query types below to go to the instructions for that type. Upon completion of that section, proceed to Creating the Custom Report Layout.
Option 1: Simple Query
Option 2: Advanced Query
Option 3: Direct-SQL Query
Use this option if the data needed to create your report is coming from one table. Click the Simple Query radio button and then click Next.
In the Select Report Fields window, identify the table to use as the data source. Use the drop-down list in the Tables field to select from the list of all available tables in your database or type the table name directly into the field if you already know it.
When a table has been selected, the list of available fields for the table will appear in the Available Fields pane.
Click an Available Field name (or as many as you’d like), then click the selection buttons between the listing fields to move the highlighted Available Fields to the Selected Fields pane on the right. Use the [>] or [<] buttons to move only selected fields to the right or left, respectively. Use the [>>] or [<<] buttons to move all fields from one list to the other. To deselect a field name, click it again.
The fields listed in the Selected Fields pane will appear on your report in the order in which they are listed. When you are satisfied with your selections, click Next.
Repeat the field selection process to select the fields that will define the sort order of your records for your report in the Set Sort Orders window.
The Tables drop-down list will contain only the table chosen in the previous step – select that table. Then, use the selection buttons to move the selected Available Fields to the Selected Fields pane. On the Sort Order drop-down menu, choose between Ascending or Descending order.
At any time in this process, click Back to go back to the previous step.
When you are satisfied with your selections in this window, click Next.
You are now on the Finish screen. This window contains the actual SQL query statement that the program uses to retrieve the data from the data source for your report. You can modify the query by editing the text in this window, if you know the right syntax for creating SQL statements; however, if you do not do this correctly, an error message will appear. We recommend that users not edit the SQL statement displayed in this window.
Click the Next button to proceed to the Report Editor.
The fields selected in the previous steps are now visible in the Fields frame of the report editor. You can now move these fields onto the Designer Canvas.
Proceed to Creating the Custom Report Layout.
Use this option if the data for your report needs to be drawn from multiple tables. The tables in your database are linked together by a common field, defining the structure of the database. It is through these links that data can be retrieved from multiple tables. It is very important that you know the structure of your tables and the types of fields in these tables. You cannot link tables using two different kinds of fields (e.g., a text field displaying the Asset ID number cannot be linked to a date field showing the maintenance date). These linked fields will be common to both tables. If you are unsure about the database structure, ask your database administrator about the properties of your tables.
In the Select Query Type window, click the Advance Query radio button and click Next.
In the Select Report Fields window, identify the tables to use as the data source. Use the drop-down list in the Tables field to select from the list of all available tables in your database or type the table name directly into the field if you already know it.
When a table has been selected, the list of available fields for the table will appear in the Available Fields pane.
Click an Available Field name (or as many as you’d like), then click the selection buttons between the listing fields to move the highlighted Available Fields to the Selected Fields pane on the right. Use the [>] or [<] buttons to move only selected fields to the right or left, respectively. Use the [>>] or [<<] buttons to move all fields from one list to the other. To deselect a field name, click it again.
The fields listed in the Selected Fields pane will appear on your report in the order in which they are listed. When you are satisfied with your selections for the first table, select the next table from the database and then select the fields from the second table.
In the example above, PartNo and Description were selected from the Part_Master table and FSName was selected from the Supplier_Master table. The two tables are linked by the common field SupplierKey, which is not one of the fields selected to appear on the report. Fields used to link tables need not be included in the Selected Fields list. Click Next when you are finished with your table selection.
After selecting your report fields from multiple tables, you now identify the link or links between the tables so that information can be retrieved from the database. Identify these links by specifying the tables and the fields that will be linked and the type of link to use.
Tables are linked through their common field (it is not necessary that the fields have the same name; it is only necessary that they be of the same type: e.g., both are text fields or both are numeric fields with two decimal places).
Use the Table 1 drop-down list to select the first table. Then select the field that is common between the two tables. Next, use the Table 2 drop-down list to select the second table and then select the field that is common between the two tables.
In the example, tables 1 & 2 have SupplierKey in common.
Next, identify the relationship between the two tables. Click the […] button to display the Join Properties window.
Three relationship options are available to link/join the tables. Make your selection and click OK. The Join Properties window will automatically close.
To commit the entries that you have made in the Define Table Links window, click the Add button. Your selections will be placed in the table in the Defined Links pane.
Click Next.
To set the order or arrangement of data in your report, choose a table from the Tables drop-down list, then select the field(s) from that table to determine the sort order of your data. Click the [>] button to add a selected field to the Selected Fields pane. Then, if desired, choose another table from the list and select additional fields. You are not limited to one table and one field since you are dealing with multiple tables. If no sort order is required, leave all fields blank.
When you are satisfied with your selection(s), click Next to view the SQL statement.
This window contains the actual SQL query statement that the program uses to retrieve the data from the data source for your report. You can modify the query by editing the text in this window if you know the right syntax for creating SQL statements; however, if you do not do this correctly, an error message will appear. We recommend that users not edit the SQL statement displayed in this window.
Click Finish to proceed to proceed to the Report Editor.
The selected fields are now visible in the Fields frame of the editor. You can now move these fields onto the Designer Canvas.
Proceed to Creating the Custom Report Layout.
Advanced users who know the full syntax for creating SQL statements can enter the SQL statement directly using this query option. The basics for creating SQL statements are included here to help you get started.
In the Select Query Type window, select the Direct-SQL Query radio button and click Next.
The Report Editor uses the Microsoft Jet database engine, a database management system that stores data in and retrieves data from user and system databases. The Microsoft Jet database engine can be thought of as a data manager component with which other data access systems, such as Microsoft Access and Visual Basic, are built.
The SELECT statement is used to query the database. A brief syntax explanation is shown below. It instructs the Microsoft Jet database engine to return information from the database as a set of records.
SELECT [predicate] { * | table.* | [table.]field1 [AS alias1] [, [table.]field2 [AS alias2] [, ...]]}
FROM tableexpression [, ...] [IN externaldatabase]
[WHERE... ]
[GROUP BY... ]
[HAVING... ]
[ORDER BY... ]
[WITH OWNERACCESS OPTION]
The following list describes the components of the SELECT statement:
Predicate: One of the following predicates: ALL, DISTINCT, DISTINCTROW or TOP. Use the predicate to restrict the number of records returned; if none is specified, the default is ALL.
* : Specifies that all fields from the specified table or tables are selected.
Table: The name of the table containing the fields from which records are selected.
Field1, Field2: The names of the fields containing the data you want to retrieve. If you include more than one field, they are retrieved in the order listed.
Alias1, Alias2: The names used as column headers instead of the original column names in the table.
Tableexpression: The name of the table or tables containing the data you want to retrieve.
Externaldatabase: The name of the database containing the tables in tableexpression, if they are not in the current database.
To perform this operation, the Microsoft Jet database engine searches the specified table or tables, extracts the chosen columns, selects rows that meet the criteria and sorts or groups the resulting rows into the order specified. The minimum syntax for a SELECT statement is:
SELECT fields
FROM table
An asterisk (*) is used to select all fields in a table. The following example selects all of the fields in the Suppliers table:
SELECT * FROM Suppliers;
If a field name is included in more than one table in the FROM clause, precede it with the table name and the dot (.) operator. In the following example, the Department field is in both the Employees table and the Supervisors table; it is the common field used to link both tables. The SQL statement selects department from the Employees table and supervisor name from the Supervisors table:
SELECT Employees.Department, Supervisors.SupvName
FROM Employees INNER JOIN Supervisors
WHERE Employees.Department = Supervisors.Department;
Creating the Custom Report Layout
Now that you have provided a source for your report, you can start creating your layout. Recall that the Fields frame is no longer empty; it now contains a list of fields from the source data that you can drag and drop onto your report canvas.

Click and drag a field name from the Fields pane onto the canvas.
You can drag as many fields as you want onto your canvas, but remember that the canvas working area is the actual edge-to-edge size of your printing paper. Also, the top of the Page Header and the bottom of the Page Footer mark the upper and lower edges of your paper. You can move the markers on the ruler bar to your desired edge margin; this will be marked by the dotted line running from the top to the bottom of the page.
When you drag a field to the canvas, not only is the data field placed on the canvas, but also a label for the field. Both of these are called controls. To see which control is the data field and which control is the label, click the control to select it and then view its properties in the Property Toolbox.
The data field name represents the name of the column in the database that stores the data. If you modify this name, the database will not find the data you are requesting; therefore, do not modify the name of the data field.
The basic report format has three sections: Page Header, Details and Page Footer. The Header and Footer information is repeated on each page of the report while Details contains the body of the report. Labels are typically placed in a Header section; database fields typically reside in the Details section.
Some reports require grouping of data – common record information is printed on one row and the rows below include other related details of the records. For example, in creating a report on tasks performed on assets, a group header would contain the Asset ID number and the rows beneath would list the types of tasks performed on the asset.
To create a group, right-click anywhere on the Designer Canvas and select Insert Group Header/Footer from the pop-up menu.
You can also use the Insert menu from the Main Menu bar and select Insert Group Header/Footer.
A new Group Header and a corresponding Group Footer appear on the canvas.
The name and other properties of the group can be changed in the Property Toolbox after selecting the data field by which you will group the data. If you know the name of the field, you can type it directly into the field or choose from the drop-down list of available fields. It is also advisable to change the Group Header name and the corresponding Group Footer name to the name of the field on which you have grouped the data. This change will be reflected in the header and footer names on the canvas. You can add as many groups as you'd like.
To add a field to your group, just drag and drop the field from the Fields frame. Make sure that you include the field defining the group. You can drag and drop as many fields as you can fit into the Detail section of your report. You can keep them in a single row or make multiple rows for each record.
You can modify the row height by dragging the button to the left of the row header up or down.
You can also directly change the row height by entering a value in the Height property in the Property Toolbox.
A third way of resizing the row height is by putting the cursor on the bottom of the row you wish to resize. The cursor will change to a double-ended arrow. Drag up or down.
The Report Settings window is used to set page setup, printer settings, grid settings and styles for your reports. From the main icon bar, click the following icon to open the Report Settings window:
![]()
The margin is the non-printing area outside the main body of your report; by default, margins in the report editor are set to 0.3” on each side. If you prefer a wider or narrower margin, click on the up or down arrow within the margin field(s). Clicking on the up arrow will add 0.1” to the width of the margin; clicking on the down arrow will subtract that amount from the width of the margin. You may also enter a value manually; if you want a ½” bottom margin, for instance, enter 0.5 in the Bottom Margin field.
The gutter is an additional area you can add to your inside margin width, increasing the non-printing area of your document. If you expect to print reports that will be bound in a ring binder, you might want to add a gutter of ¼” to ½” to allow for holes to be punched.
Click on the up or down arrows to increment this value by 0.1” or enter a value manually as desired. If you are printing on the front and the back of a page and your left and right margins are different (or if you have added a gutter to your pages), you will probably want to check the Mirror Margins checkbox. Checking this box automatically sets your margins so that the inside margins of facing pages are the same, and the outside margins as well, just as if they were reflected in a mirror. (When you check this box, the margin display changes from a single right-hand page to two facing pages with mirrored margins.)
By default, the program follows the default settings of the printer. These settings can be found in the Properties setting of the printer in the Windows printer setup. For your convenience, we have added a facility within the report editor to modify these settings to suit your report. To access these settings, click the Printer Settings icon in the Report Settings window.
Use this window to appropriately and uniformly style the type in your reports. Four basic styles are included for your convenience: Normal, Heading1, Heading2 and Heading3. Each of these styles has different attributes according to how it might be used in a document; for instance, the Heading styles are all bold for emphasis, while the Normal style is plain rather than bold and of a suitable size for body text on a page.
Use the controls in the right-hand pane of the Styles window
to modify the font, size, color or alignment of a style. Create new styles
by clicking the New button under the list of styles.
Note: New styles or modifications to existing styles in a given report appear only in that report.
To apply a text style to an element in the Designer Canvas, select the element, then choose the desired style from the drop-down list at the top left of the window, just above the ruler.
The tiny dots that are evenly distributed over the canvas make up the grid, which is intended to give you guidance in the design and layout of your report. The dots will not appear on your printed report. The spacing of the dots in rows and columns is defined within Global Settings. By default, there are 16 dots to an inch, both horizontally and vertically.
By default, the Show Grid checkbox is checked. Uncheck this box to hide the grid. Check the Align Controls to Grid checkbox if you want the elements on the Designer Canvas to snap to the grid.
Note: Sometimes you may want to uncheck this option to position elements more closely together than your grid will allow.
Use the Ruler Units drop-down list to specify inches or centimeters as you prefer.
Use the Grid Columns and Grid Rows fields to specify the number of dots per ruler unit.
Note: If you change your grid unit to centimeters, you may want to reduce the number of dots per ruler unit to 10 or even 5 to keep your canvas from being overcrowded with grid dots.
When you are satisfied with all choices made within the Report Settings window, click OK.
Every report must have a page header and footer. The page header usually contains the report title and the titles of the columns. The footer usually contains the page number. You can create titles using the label button; the report editor also includes buttons that generate automatic page numbers and a date-time stamp. Click the desired button. A field containing the pertinent information will appear on the Designer Canvas; drag it wherever you want that information to appear.
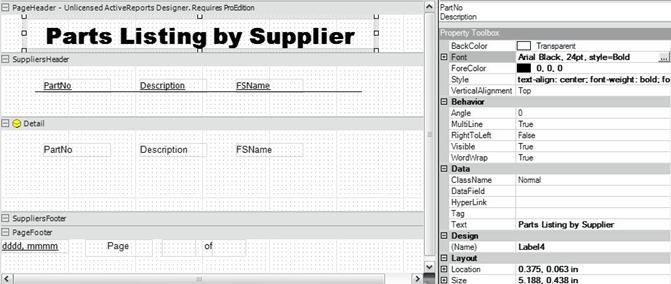
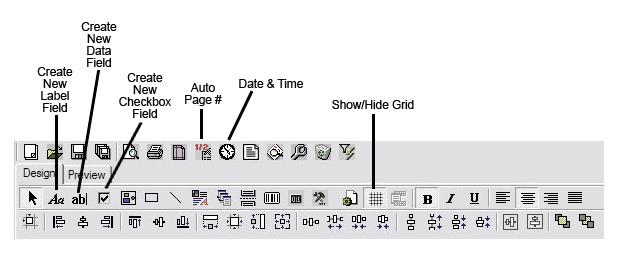
To create the field for the report title, for example, click the Create New Label Field icon. Then, on the canvas, click and drag a box shape; this dictates the size and position of the label field, both of which can be modified at any time.
With your new field selected, look at the Data section of the Property Toolbox (shown above). In the Text field, type the words to appear in your new field.
Now, look at the Font section of the Property Toolbox (shown above). Click the […] button and a formatting window will open, allowing you to specify font style, weight, etc.
To change a property such as font style in several elements at the same time, select them by clicking your mouse and dragging across the items or click on the items one at a time while holding down the CTRL key. Then change the formatting as you wish.
A sub-report is a report within a report; each sub-report pertains to a record in the main report. Sub-reports are very handy when you want to include details in your report but cannot include additional tables for the details in the main SQL statement.
A great deal of planning is needed when building reports and considering the addition of sub-reports. Sometimes you can include the data in your master data source (SQL Query) and just create sub-groups for this data. However, when your report format requires large amounts of detail, sub-reports can be designed separately and then linked to your main report.
Link Fields are very critical. They must be of the same type – they may not have the same name but should have the same type of content. However, here we have made sure that fields of the same name have the same type of data. Also, primary key fields (common fields with unique values, used to link tables) must have the same kind of content.
Sub-reports are designed in a separate Designer Canvas and then linked to the main report document. You must make sure that the sub-report has at least one field in common with the main report to which it is linked (contents and type). The advantage of sub-reports is that they are designed only once and can be used repeatedly in different reports.
Create a new blank report. Remove the page header and footer; they are not needed in a sub-report. To do this, select the header title bar, right-click and choose Delete Section from the pop-up menu that appears. Only the Details section will remain; this is where the fields for the content of the report will be placed.
Now you need a group heading. The data field you use for this heading should be the field that you use to link with the master report. It is not necessary to reflect the content of the data field in the heading but you must make sure to set the DataField in the Property Toolbox into the link field.
You can add more groups to this report, but make sure that the topmost group contains the link field.
When you are finished, save the sub-report with an appropriate name. We suggest that you indicate within the name that this is a sub-report, since it will not have its own page header.
To add a sub-report, click the Sub-report button on the button toolbar, then click and drag the cursor across the canvas to create a rectangle which will contain your sub-report.
![]()
Now that you have created a container for your sub-report, you must edit the link to the sub-report you created earlier. Click the Edit Sub-Report Link button to open the Sub-report Custom Properties window.
![]()
First, define the Report Source or select the name of the pre-defined sub-report from the drop-down list.
After selecting the source, you will be able to view the SQL statement that opens the data source of the report. You must now create the link filter to connect the sub-report to the main report.
Use the Sub-report Fields drop-down list to select a field from the sub-report to which to link. If more than one table in the data source contains this field, you must specify the table name in the Table (Optional) field.
Select the Operator to use in comparing the fields.
Indicate the Value to which you want to filter. You have 3 choices for this:
A specified fixed value.
Link to the current field value of the master report.
An external criterion is indicated by the contents of a field in the sub-report.
Add the criteria to the list by clicking the Add button.
If you need more than one criterion, repeat these steps using a statement connector. The default is AND. To use OR, click the OR button before creating another criterion.
When you are finished, click OK. To discard, click Cancel.
The fields and buttons of the Sub-Report Custom Properties window are described here:
Report Source: This is a drop-down list of all available reports. Select a sub-report from the list.
SQL: The SQL statement used in opening the data source of your sub-report. This is a non-editable field and is provided here so you can immediately see the tables and fields that are used in your sub-report. This is particularly helpful in finding out if the field you need to use for the link is contained in only one table or more than one.
Refresh: Refreshes the SQL screen.
Table (optional): If your link field is contained in more than one table in your source, you must specify the table to use for your field. If only one source table uses this field, you may leave the Table field blank.
Sub-report Fields: The name of the link field from your sub-report.
Operator: The operator for comparing the link field to a value.
Value: You have three choices for filter value:
Fixed value – your report will be limited to only the value.
Field – this drop-down list is taken from all the available fields of your master report.
External – a value you create that is not included in the database, i.e., totals.
Add, Remove & Clear: Click the Add button to add a criterion. Select a criterion from the list and click Remove to delete the selected criterion. The Clear button deletes all criteria.
OR: By default, criteria are linked with the AND connector. To use OR instead of AND, click OR before adding a criterion.
OK: Click OK to apply the changes you have made to your criteria.
Cancel: Click Cancel to discard the changes you have made to your criteria.